Finance Periscope
How football players are valued — and why a single number lies
Crowd estimates, econometric models and XAGON’s own method all answer “what is he worth?” differently. The honest answer is a range, not a figure.
Published 2026-11-02T16:11:40.777000Z · Updated 2026-11-02T16:11:40.777000Z
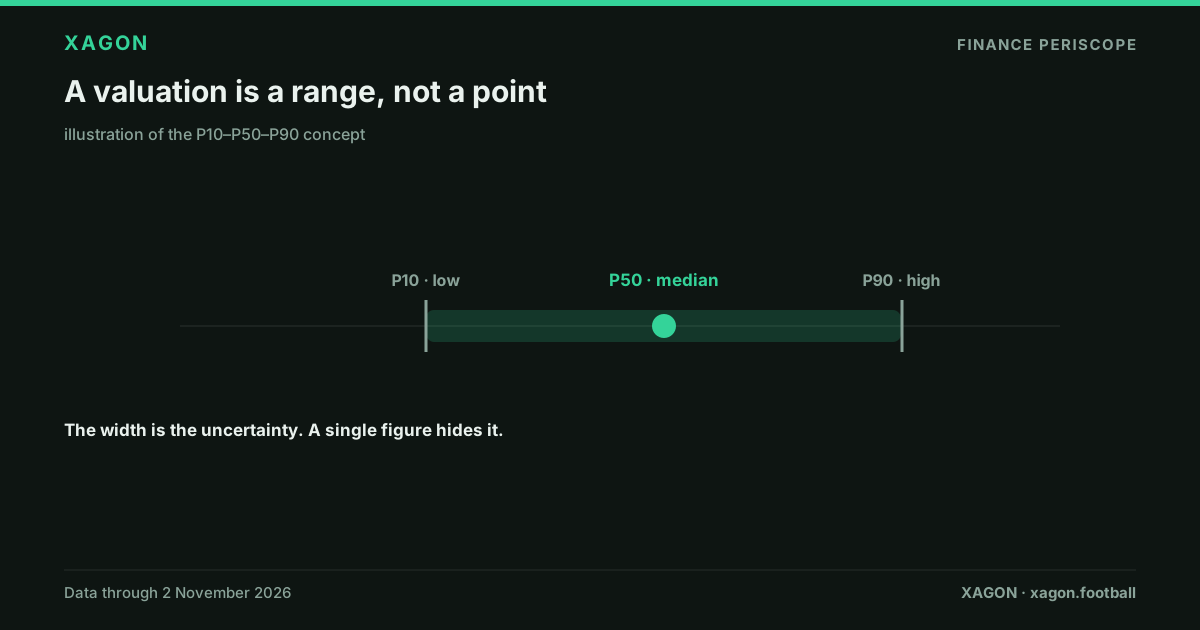
Football players are valued in three broad ways — crowd estimates, econometric models, and a club’s private view — and the most defensible answer to “what is he worth?” is a range, not a single number.
The three approaches
Crowd platforms aggregate informed opinion. Econometric models fit historical transfer fees to measurable variables. Clubs hold private views shaped by need and budget. The academic benchmark is the CIES Football Observatory model, a multiple linear regression built on more than 2,000 paid transfers from the big-five leagues; it reports explaining over 80% of the variation in fees paid, as described in its peer-reviewed paper and methodology report.
What actually drives the number
The same research identifies the heavy variables: remaining contract length, age, recent performance (minutes, goals, assists), the level of the player’s league, and a season variable for market inflation. Transfer rumours are explicitly excluded. This is why value can move sharply on a contract running down even when performance is flat.
The XAGON view
XAGON publishes a value distribution — a P10 low, a P50 median and a P90 high — from public data, with an uncertainty class, rather than a false-precision single figure. It is a model estimate, not an appraisal and not advice. Compare live estimates and ranges on Markets, and read why accounting book value differs from market value.